Case Study 1: Chambéry
Table of Contents
Chambéry
Chambéry is a French city in the Savoie department, near the Alps. In 2021, the population of Chambéry was 59,856.
.JPG)
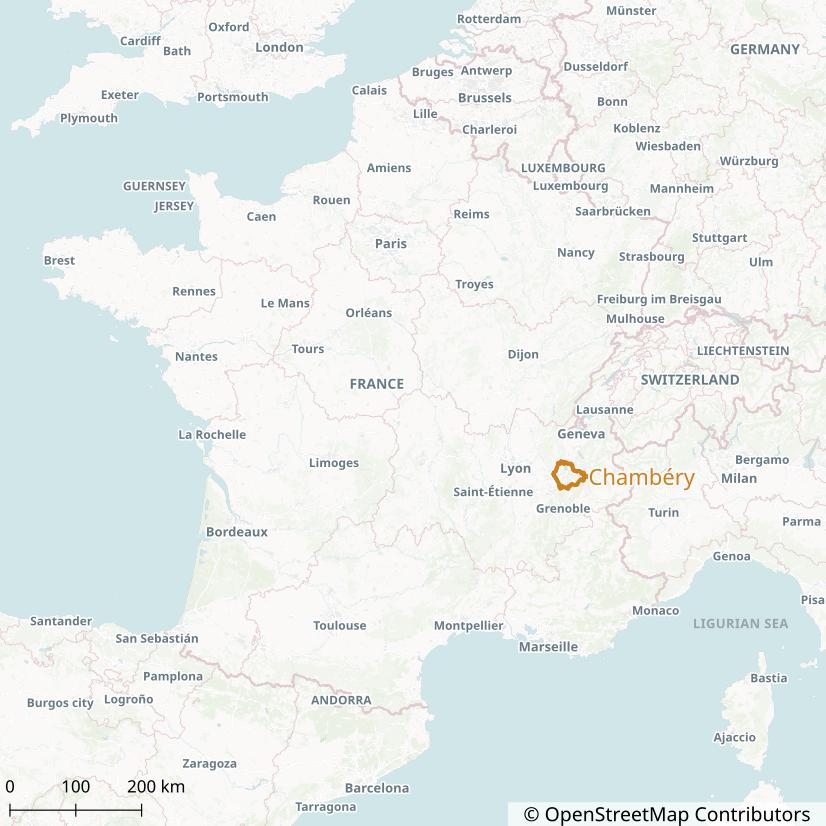
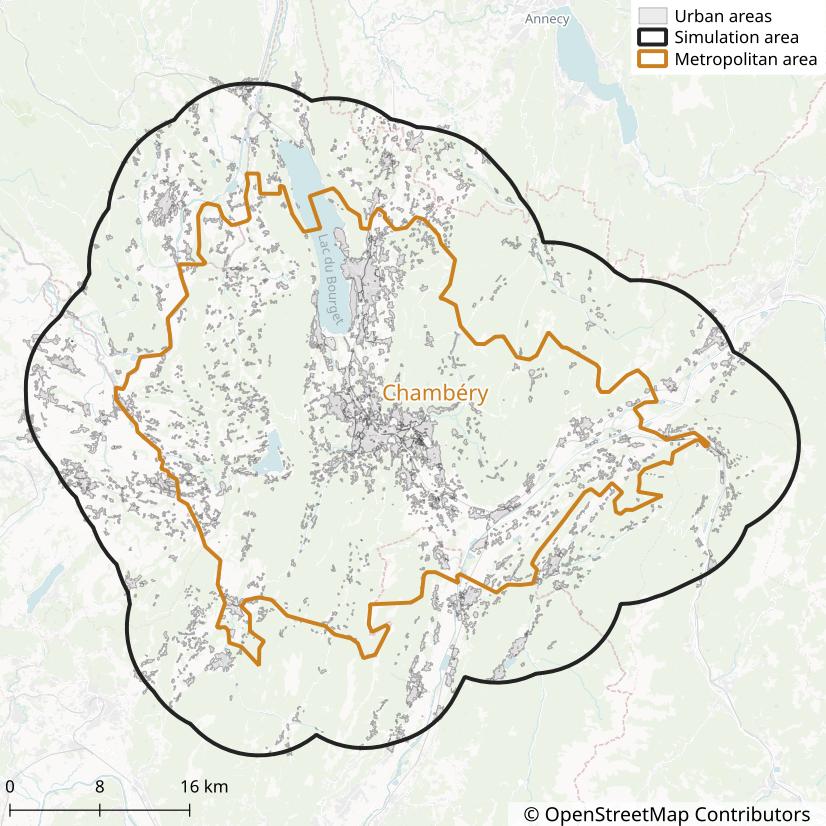
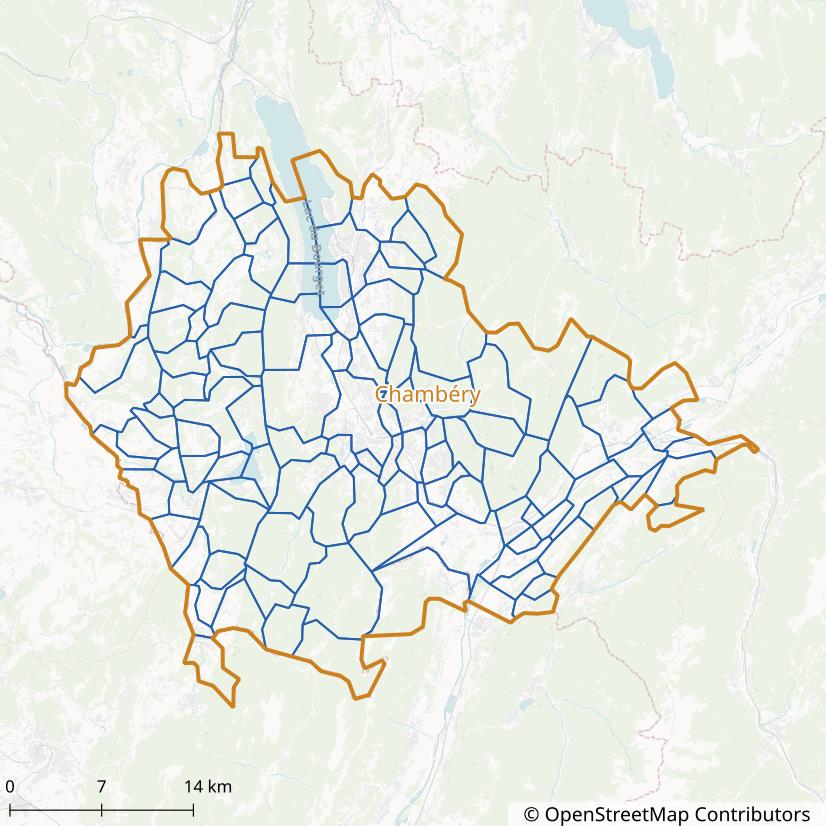
It is the largest city of the Chambéry Metropolitan area (Aire d’attraction de Chambéry) which has a population of 261,463 and an area of 1,147 km² (2021). The Metropolitan area of Chambéry consists of 115 French municipalities.
Chambéry has been selected for this case study due to its small size (reducing running times) and the availability of a recent travel survey (2022).
General Configuration
Before running the metropy pipeline, we need to create the TOML configuration file that specifies all the parameters of the simulation.
Create the config-chambery.toml file with the following content:
# File: config-chambery.toml
main_directory = "./chambery/output/"
crs = "EPSG:2154"
osm_file = "./chambery/data/rhone-alpes-250101.osm.pbf"
The main_directory variable represents the directory in which all the output files generated by
the pipeline will be saved.
The directory will be created automatically if it does not exist yet.
The crs variable represents the projected coordinate system to be used for all operations with
the spatial data (such as measuring the length of the road links).
The value "EPSG:2154" represents the Lambert-93 projection, which is
adapted for any area in Metropolitan France.
The osm_file variable specifies the path to the OpenStreetMap input file that will be used to
import the road and walking network.
We use the extract of the Rhône-Alpes French administrative region from 2025-01-01, that can be
downloaded from Geofabrik (click on
raw directory index to access older versions).
The Rhône-Alpes region is adapted for our case study given that the Chambéry urban area is full
contained within it.
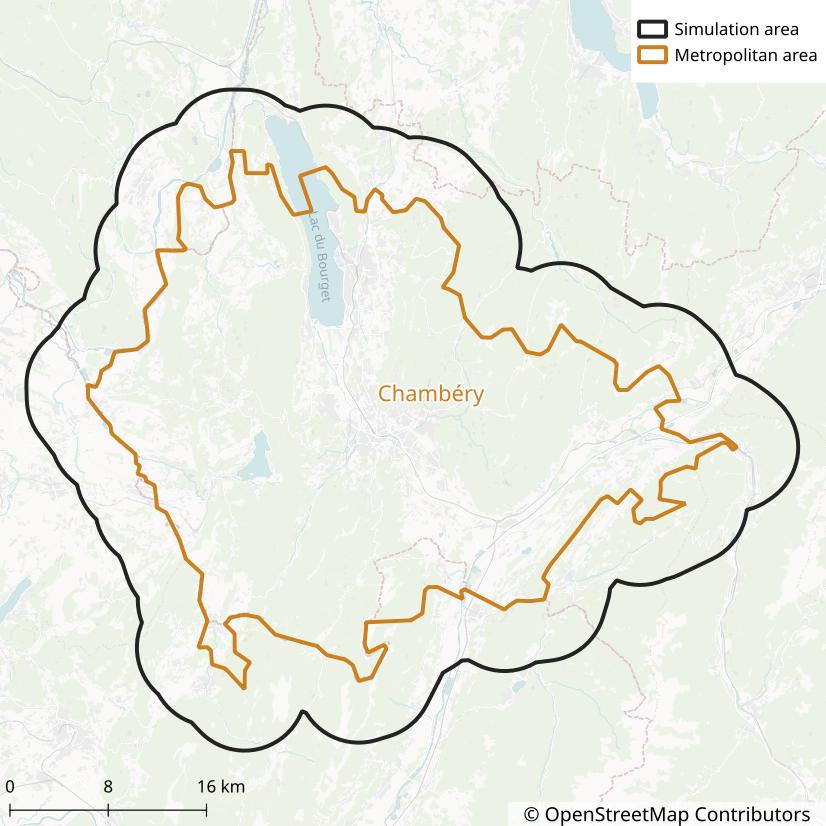
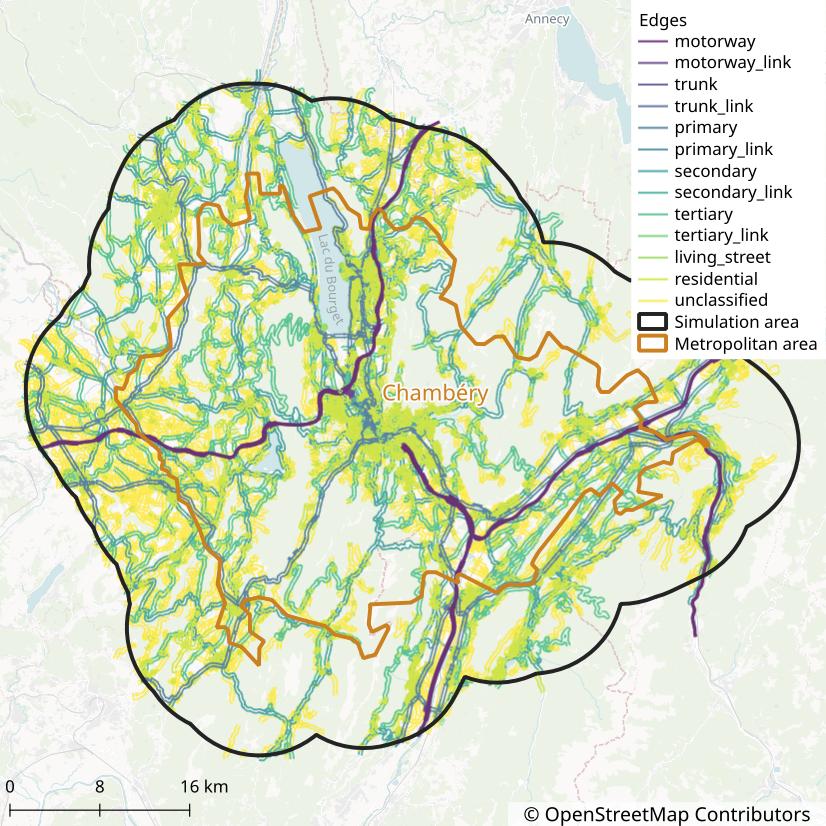
Simulation Area
- Step:
simulation-area - Running time: 2 seconds
We define the simulation area as the Chambéry Metropolitan area (aire d’attraction) so that we get an area large enough to encompass most of the trips from and to Chambéry’s municipality.
To tell metropy to create the simulation area from the Chambéry Metropolitan area, add the following section to the configuration:
[simulation_area]
aav_name = "Chambéry"
buffer = 8000
The buffer = 8000 line tells metropy to extend the area by 8 kilometers in all directions.
This is used to include roads in the simulation that are not inside the Metropolitan area but that
could be taken when traveling between two municipalities within the area.
The output file ./chambery/output/simulation_area.parquet can be opened with QGIS to draw a map.
OpenStreetMap Road Import
- Step:
osm-road-import - Running time: 2 minutes
We use the osm-road-import step to import the road network from OpenStreetMap.
The step will read the osm_file variable previously defined.
Add the following section to the configuration:
[osm_road_import]
highways = [
  "motorway",
  "motorway_link",
  "trunk",
  "trunk_link",
  "primary",
  "primary_link",
  "secondary",
  "secondary_link",
  "tertiary",
  "tertiary_link",
  "living_street",
  "unclassified",
  "residential",
]
urban_landuse = [
  "commercial",
  "construction",
  "education",
  "industrial",
  "residential",
  "retail",
  "village_green",
  "recreation_ground",
  "garages",
  "religious",
]
urban_buffer = 50
The highways parameter lists all the OSM
highway tags to be imported.
In this case, all the standard tags are considered, including living streets, residential streets
and unclassified streets.
We do not consider however the service and road tags, which usually represent car park alleys or
other special roads we are not interested in.
The urban_landuse parameter lists all the OSM
landuse tags to be classified as urban.
The roads which are fully contained within urban areas will be classified as “urban”.
The urban areas are extended by 50 meters, through the urban_buffer parameter, so that roads
partially outside urban areas are also classified as “urban”.
After the step is completed, some statistics are reported in the file
./chambery/output/osm-road-import/output.txt.
They show that the imported road network has:
- 37 088 nodes
- 77 884 edges
- The total length of edges is 13 990 km
- 69.4 % of edges are classified as “urban”
- 2.2 % of edges are roundabouts
- 0.5 % of edges have traffic signals
- 1.0 % of edges have a stop sign
- 1.3 % of edges have a give-way sign
- 1.0 % of edges have tolls
- 68.7 % of edges do not have a speed limit reported
- 84.4 % of edges do not have a number of lanes reported
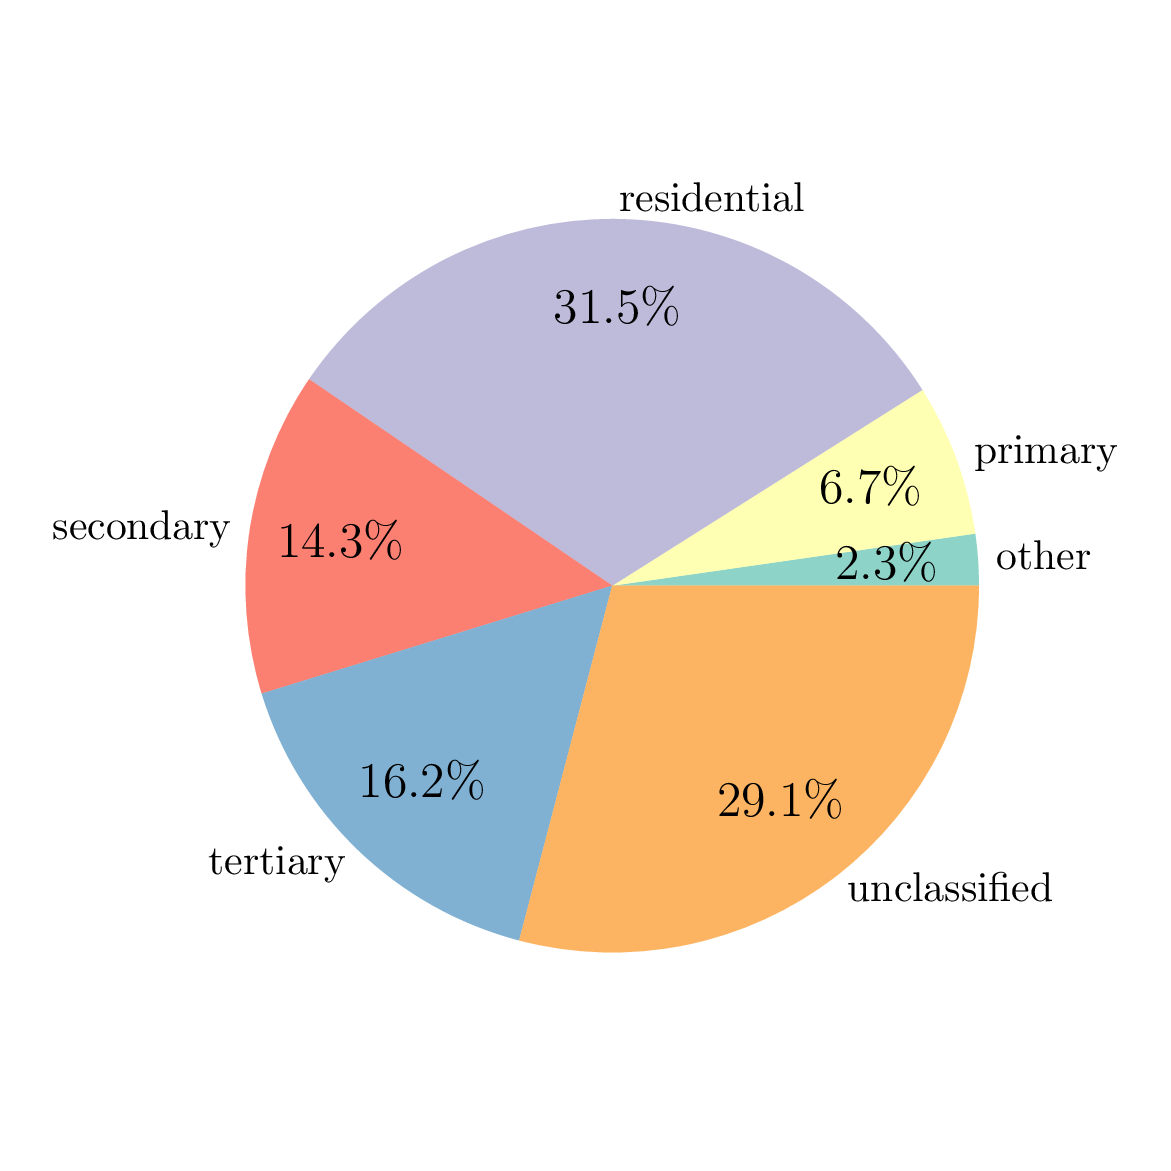
The directory ./chambery/output/graphs/osm-road-import/ also contains some graphs generated from
the imported data.
For example, the following pie chart reports the share of edges by road type (the category “other”
regroup all road types with few observations).
The two output files ./chambery/output/osm-road-import/edges_raw.parquet and
./chambery/output/osm-road-import/urban_areas.parquet can be opened with QGIS to draw a map of
edges…
and urban areas…